Are you a system architect ? Are you planning to convert the physical servers to VM ? If yes, perform the IOPS test on the physical machines prior to migrating it to VM. If you have test virtual machine in the targeted VMware infrastructure, perform the similar IOPS test to compare the results. If the results are almost same or better than physical machine IOPS , you can proceed with P2V. In case the virtual machine IOPS are less than physical machine, you need to consult with application and DBA team with the IOPS results of the VM.
Let’s see how the IOPS(Input Output Per Second) are calculated.
Here is the formula to calculate the IOPS :
- IOPS = 1/(Avg. Latency + Avg. Seek)(ms) (per Disk )
- Total IOPS = IOPS * Total number of Disks.
– Average Latency – Time for sector being accessed to be under a r/w head
– Average Seek – Time it takes for hard drive’s r/w head to position itself over the track to be read or written.
For an example, We have the following disks in your system.
- 4 X 512 GB 10kRPM SAS (RAID 0)
- Avg. Latency = 4ms
- Avg. Seek = 5ms
IOPS = 1 / (0.004+0.005) = 111 IOPS
Since we have 4 Drives in RAID 0 , So total IOPS = 4×111 = 444 IOPS . Hope now you got a fair idea about how IOPS are calculated.
In this article ,we will see that how we can calculate the IOPS of Redhat Linux VM which is running on VMware ESXi 6.0 hypervisor. To calculate the IOPS , you need a tool called iometer. This tool can be downloaded from iometer.org.
IOMeter is composed to two different parts.
- dynamo
- Iometer
The host process is called dynamo, which is responsible for performing the actual I/O operations. It is available for both windows & Linux. The graphical IOMeter client which communicates with dynamo and presents the results and its only available for windows. So when you actually want to perform the IOPS test on Linux box, you need windows machine on the same network to see/store the results.
1. Download the Iometer package for windows from iometer.org. It contains both Iometer & dynamo. (Here we just need Iometer utility to see the results)
2. Download the Iometer package for Linux . It contains dynamo package.
3. Copy the Dynamo Linux package to the Linux VM and unzip/un-tar it .
[root@RHEL7 ~]# ls -lrt
total 64
-rw-------. 1 root root  1089 Jun 13 20:29 anaconda-ks.cfg
-rw-r--r--. 1 root root  1140 Jun 13 20:33 initial-setup-ks.cfg
-rw-------. 1 root root 55419 Jun 13 20:40 iometer-1.1.0-linux.x86_64-bin.tar.bz2
[root@RHEL7 ~]# bunzip2 iometer-1.1.0-linux.x86_64-bin.tar.bz2
[root@RHEL7 ~]# ls -lrt
total 156
-rw-------. 1 root root   1089 Jun 13 20:29 anaconda-ks.cfg
-rw-r--r--. 1 root root   1140 Jun 13 20:33 initial-setup-ks.cfg
-rw-------. 1 root root 150016 Jun 13 20:40 iometer-1.1.0-linux.x86_64-bin.tar
[root@RHEL7 ~]# tar -xf iometer-1.1.0-linux.x86_64-bin.tar
[root@RHEL7 ~]# ls -lrt
total 304
-rwxrwxrwx. 1 root root 148314 Mar 26  2014 dynamo
-rw-------. 1 root root   1089 Jun 13 20:29 anaconda-ks.cfg
-rw-r--r--. 1 root root   1140 Jun 13 20:33 initial-setup-ks.cfg
-rw-------. 1 root root 150016 Jun 13 20:40 iometer-1.1.0-linux.x86_64-bin.tar
[root@RHEL7 ~]#
4. Here I am using /dev/sdb for the IOPS test which doesn’t have any filesystem on it. (Only raw device disk can provide the real IOPS)
Disk /dev/sdb: 1073 MB, 1073741824 bytes, 2097152 sectors
Units = sectors of 1 * 512 = 512 bytes
Sector size (logical/physical): 512 bytes / 512 bytes
I/O size (minimum/optimal): 512 bytes / 512 bytes
5. Execute the dynamo with below options. (change the IP’s according to your environment. )
[root@RHEL7 ~]# ./dynamo -i 172.25.2.150 -m 172.25.2.151 -n RHEL7 -d /dev/sdb
Dynamo version 1.1.0, x86-64, built Mar 25 2014 22:08:27

Command line parameter(s):
   Looking for Iometer on "172.25.2.150"
   New manager name is "RHEL7"
Sending login request...
   RHEL7
   172.25.2.151 (port 51460)
Successful PortTCP::Connect
  - port name: 172.25.2.150

*** If dynamo and iometer hangs here, please make sure
*** you use a correct -m  that
*** can ping from iometer machine. use IP if need.
   Login accepted.
Reporting drive information...
Here ,
- -i 172.25.2.150 = windows iometer client
- -m 172.25.2.151 = The Linux machine IP address. (localhost)
- -n RHEL7 = hostname
- -d /dev/sdb = raw disk/LUN .
6. Go back to your windows machine which is in the same network . Execute the IOmeter.
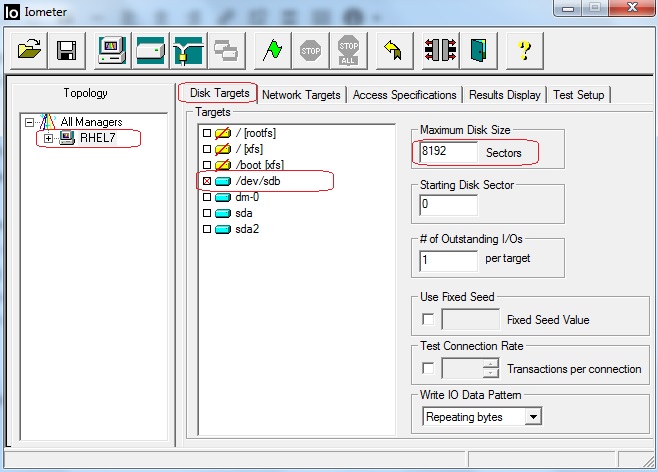
Here you can see that Iometer is automatically connected with Linux machine and default worker will be added. Select the disk targets and select the LUN in which we are going to perform the IOPS test. Set the maximum disk size as 8192 sectors.
7. Navigate to the access specification and add 32KB Read/write access profiles like below.

- 32KB 0% Read 0% Random – will test large sequential writes;
- 32KB 100% 0% Random – will test large sequential reads;
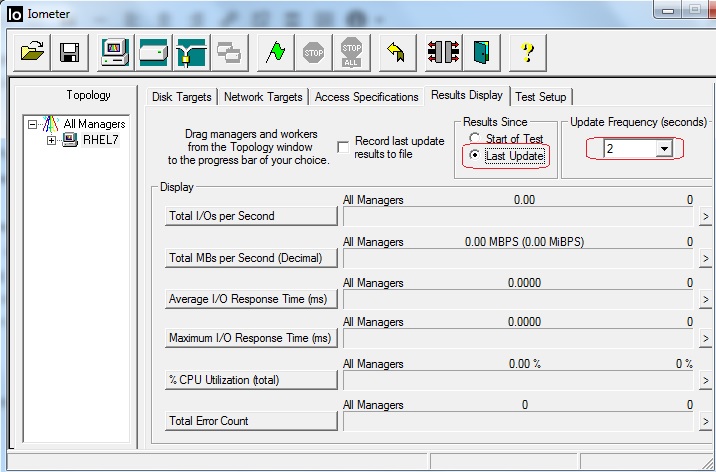
8. Click on results display. Select Results since as ” Last update” and update frequency as 2 seconds. Click the Green flag in the icon to start the test.
9. Once you start the test , results will save in CSV format. You can choose the location to save the CSV file. You will also see the results like below.
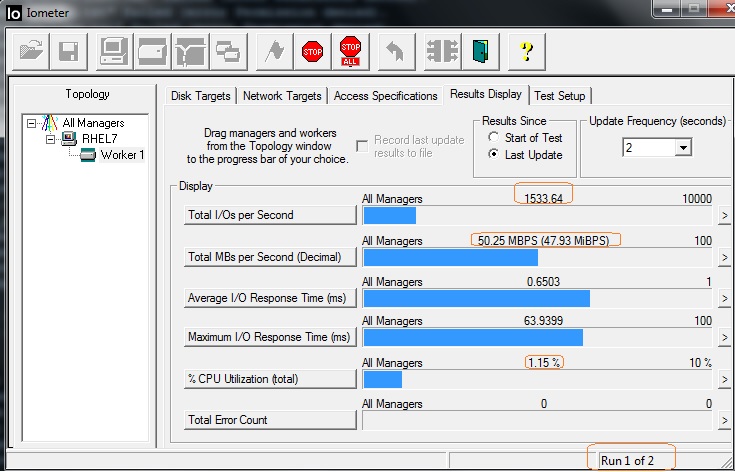
The above screen show the 1 of 2 test. You can also see the I/Os per second and Total MBs per Second in decimal format.
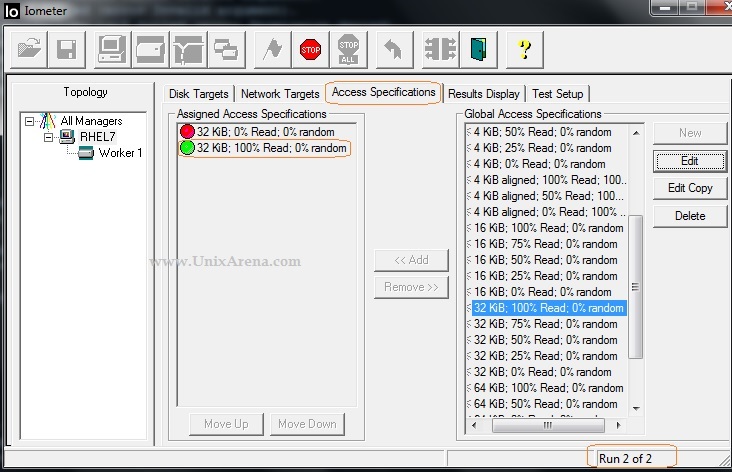
10. To know what test is running currently , please click on the “Access Specifications” tab.
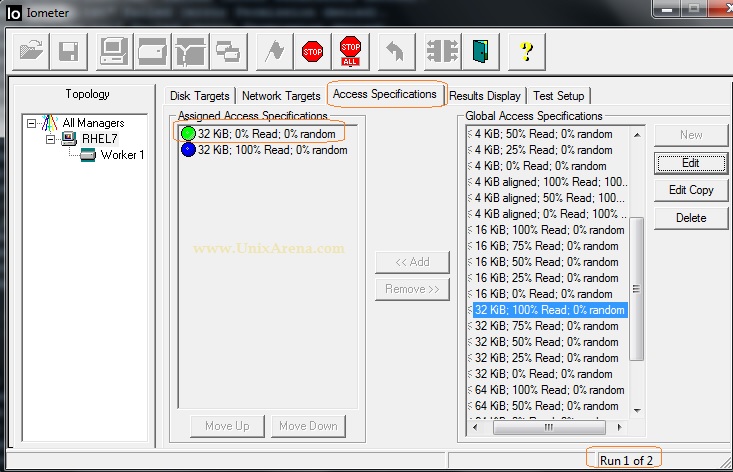
You need to wait until you see the stable results for the first test. Once you see the stable results, click on stop button. This will end the first test (32KB 0% Read 0% random 100% Sequential writes ).
11. Once the second test kicks off , you will see the results like below.
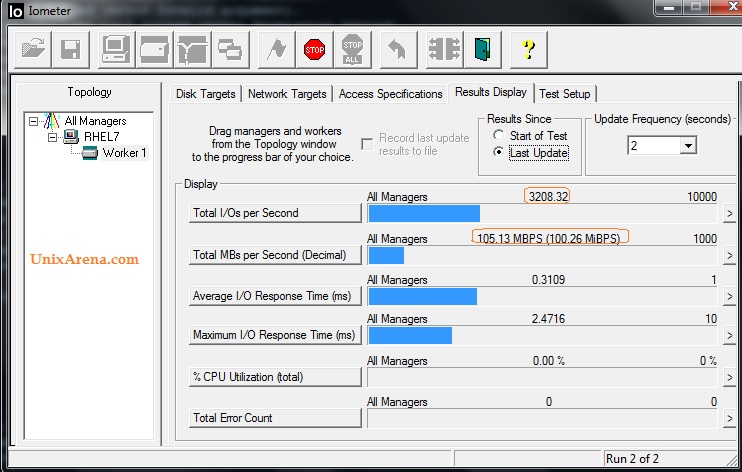
12. Click on “Access specification” tab to confirm that what test is being performed.
After seeing the stable results for the second test, just stop the test by pressing stop button.
All the IPOS results are saved in the CSV which you have saved. Here is the sample file which iometer has generated.
In the Linux machine , you can see the console output like below.
Beginning to perform I/O...
   Stopped.
Stopping...
   Stopped.
Worker 0 running Access Spec: 32 KiB; 0% Read; 0% random
Access specifications for test defined.
Grunt: Grunt data buffer size 32768 >= 32768, returning
Worker 0 setting targets...
Seeding random Number Generator(425766509419)
   Generating random data...
Starting...
Beginning to perform I/O...
   Opening targets.


Worker 0 running Access Spec: 32 KiB; 100% Read; 0% random
Access specifications for test defined.
Grunt: Growing grunt data buffer from 32768 to 32768
Worker 0 running Access Spec: 32 KiB; 100% Read; 0% random
Access specifications for test defined.
Grunt: Grunt data buffer size 32768 >= 32768, returning
Worker 0 setting targets...
Seeding random Number Generator(425675578006)
   Generating random data...
Starting...
   Opening targets.
Beginning to perform I/O...


Beginning to perform I/O...
   Opening targets.
   Stopped.
Stopping...
   Stopped.
Removing worker 0.
Removing all workers.
Ending execution.
[root@RHEL7 ~]#
Iometer is really helpful in virtualization environment and iscsi storage attached systems to measure the real throughput. Here is the list of items which can be measured by iometer.
Total I/Os per Second.
- Read I/Os per Second
- Write I/Os per Second
- Transactions per second
- connections per second
Total MBs Per Second (Decimal)
- Read MBs per second
- Write MBs per second
Total MBs per second (Binary)
- Read MBs per second (Binary)
- Write MBs per second (Binary)
Average I/O response time (ms) (Average Latency)
- Average read response time (ms)
- Average write response time (ms)
- Average connection time (ms)
- Average transaction time (ms)
Maximum I/O response time (ms) (Maximum Latency)
- Maximum read response time(ms)
- Maximum write response time (ms)
- Maximum connection time (ms)
- Maximum transaction time (ms)
% of CPU utilization (total)
- % user time
- % privileged time
- % DPC time
- % Interrupt time
- Interrupts per second
- CPU effectiveness
Total error count
- Read error count
- Write error count
Hope this article is informative to you . Share it ! Be Sociable !!
The post How to Generate and Measure IOPS in VMware Guest ? appeared first on UnixArena.


